Posts

Adam Smith Crude Technical Report
Image
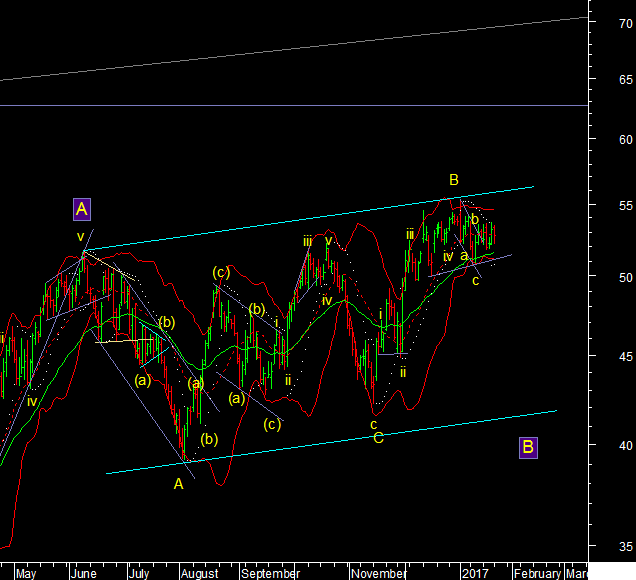
51.50 and 51 are critical support levels for crude. A close below it would imply a change in wave count in favour of wave B forming as a flat. the reason is that after many weeks the daily chart is still not breaking out and momentum is still in sell mode. Positions are getting close to an extreme making the move higher difficult so prices may react. A break of key supports could trigger a move lower towards 45 or 42$ before wave C up can start. On the upside 55.89 can act as a resistance. Adam Smith Associates offers trade & commodity finance related services & solutions to its domestic & international clients. Views expressed in this article are purely of the author - Mr Rohit Srivastava - a leading technical analyst. Visit www.adamsmith.tv for services offered by Adam Smith Associates Pvt Ltd

Adam Smith - Gold Technical Analysis

Image
Gold prices ticked up above the point marked as wave I. So are we still in wave II down? There are times that prices extend without a pause so the question is where to consider that. The only pattern where wave b of II goes higher is called an expanded flat. In that prices do not go above the Fibonacci ratios of 123.6% or 138.2% of wave a. So the levels are 1224 and 1228. A top near these levels can mean that we are still in wave II down and will correct to 1180 before going higher. But once we cross 1228 then we have to consider that wave III up started already without a halt. While that is unusual it is not impossible Adam Smith Associates offers trade & commodity finance related services & solutions to its domestic & international clients. Views expressed in this article are purely of the author - Mr Rohit Srivastava - a leading technical analyst. Visit www.adamsmith.tv for services offered by Adam Smith Associates Pvt Ltd

Adam Smith Associates Pvt Ltd - Technical Analysis on USD v/s INR, Euro and Aluminium

Image
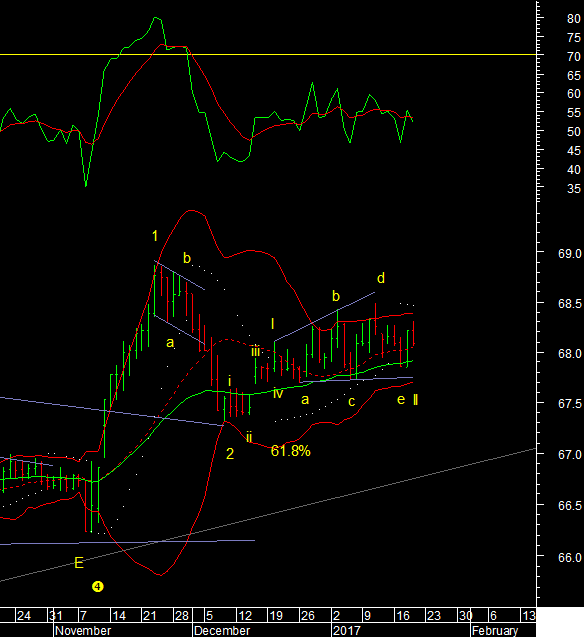
Adam Smith Associates Pvt Ltd - Technical Analysis on USD v/s INR, Euro and Aluminium USDINR - has been in a trading range and support is at the lower end near 67.75. 67.75, is close to 61.8% of the December move and also the lower Bollinger band so it is a good support and should mostly hold. The next move up has not started but when it does we should go beyond the 68.86 high. Wave III of 3 would be the label for the next move. Euro formed a leading diagonal, that means a rise that has the wave structure of a 5-3-5-3-5, and is therefore the first wave of a larger bullish move. The dip yesterday therefore is wave ii. With support at 1.3057 it is possible that wave ii is over. We can also get one more dip to test 1.054 before going higher but it is not a certainty. Once the next move up starts we should see it go test 1.087 Aluminium prices started their next move after making a higher swing bottom at 120.65 This move is likely to carry it to 130 in minor wave iii

Adam Smith Associates Technical Report On US Dollar

Image
USDGBP USDGBP is in a consolidation phase longer term. Marked as a 4th wave, 4th waves are often triangles. Alternatively a falling channel can take the shape of a flat. What this means is that new highs are unlikely. We are in wave C down. If a triangle is forming we should hold the retracements up to 0.80. Below that odds will favour the channel scenario in which it drops to 0.7750. It is aligning with the weak dollar environment USDAUD The AUD bottomed against the dollar a year back. So the USDAUD pair has been falling since. It was bouncing around in a range that is marked as wave B. Wave C down has started and should carry it far lower to the lower end of a falling channel at 1.23 USDCAD USDCAD - broke down from the triangle pattern see in wave C. The Long term pattern is one of a Head and Shoulders top. The pink neckline of the shoulders is the last support at 1.2845. The pattern suggests that this level will break. We have started wave C down fr

Adam Smith - Nikkie Technical Report

Image
The top in the dollar is also a bottom for the Yen and a top for the USDJPY contract that has been the main driver for Japan. The Nikkie index therefore has topped at the end of 3 waves at 78.6% retracement of the previous fall and another move lower may have started in wave C down at larger degree. The lower end of the channel is at 13800. Adam Smith Associates offers trade & commodity finance related services & solutions to its domestic & international clients. Views expressed in this article are purely of the author - Mr Rohit Srivastava - a leading technical analyst. Visit www.adamsmith.tv for services offered by Adam Smith Associates Pvt Ltd

Adam Smith Associates - Is Philippines going through crisis?

Image
Philippines - PSE Composite, fell in 5 waves before the recent bounce. It was mostly a counter trend bounce in what is wave C of a bear market. This market remains a weak spot in Asia. The recent rally in wave 2 stopped at the 50% retracement mark and till we stay below it we may have already have started the next major wave lower. The big Picture below also shows a head and shoulders pattern Long term. Chances are that the next move lower will now break the neckline. For something this massive to happen Philippines must be going through some major crisis in the Asian region. Adam Smith Associates offers trade & commodity finance related services & solutions to its domestic & international clients. Views expressed in this article are purely of the author - Mr Rohit Srivastava - a leading technical analyst. Visit www.adamsmith.tv for services offered by Adam Smith Associates Pvt Ltd

Adam Smith Associates - Watch out dollar index

Image
The dollar index has been forming an expanding triangle for months. The Dollar closed below the 101.10 level of the yellow trendline that marks the upper end of an expanding pattern. In short the failure to breakout amounts to a false breakout and the implications of the failure should be a move back to the lower end of the range in the coming year to near 91 Adam Smith Associates offers trade & commodity finance related services & solutions to its domestic & international clients. Views expressed in this article are purely of the author - Mr Rohit Srivastava - a leading technical analyst. Visit www.adamsmith.tv for services offered by Adam Smith Associates Pvt Ltd