Adam Smith Associates - Euro & US 10 Years Treasury Notes Technical Analysis
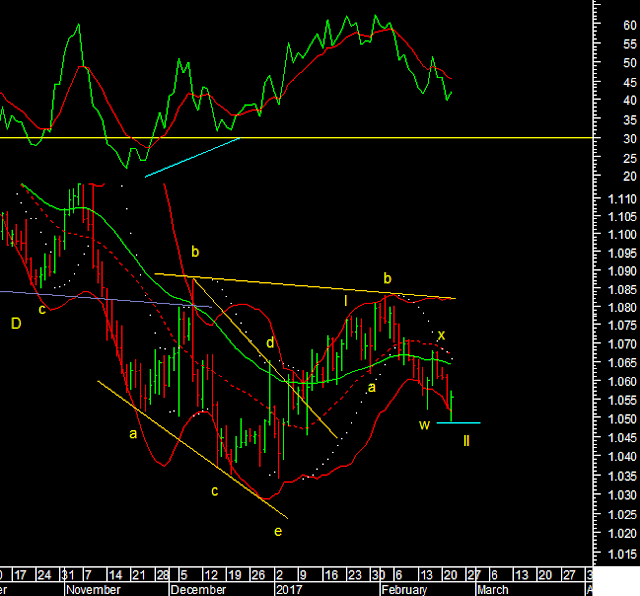
Adam Smith Associates offers trade & commodity finance related services & solutions to its domestic & international clients. Views expressed in this article are purely of the author - Mr Rohit Srivastava - a leading technical analyst. Visit www.adamsmith.tv for services offered by Adam Smith Associates Pvt Ltd Euro The Euro made a minor new low and bounced back. On the hourly chart its again broken out of a falling channel for the 3 day decline. The rally for 2017 so far was wave I. So we have now retraced 70.70% of the rise in wave II. Wave III up should be next and should test the 1.08 level. US 10 Years Treasury Notes US T notes rallied, as expected since December. But as you see it is a slow moving animal. So as we broke out of a inverted H&S bottom yields will fall further in the coming months. Now unlike EWI I have marked the rise as I-II-III etc of Wave A, while they are marking a-b-c and expecting an immediate decline. I am considering a


