Posts

Showing posts with the label Commodity

4 Current Commodity Tips You Need to Know About

Image
  Commodities are an incredibly strong investment choice. A great way to build a diverse portfolio, they lack the volatility of stocks while providing great room for financial growth. But investing in commodities without knowing what you're doing is a bad idea. If you want to make this investment, you'll need to develop an intelligent strategy. Here are some commodity tips to help you make that move. Commodities Explained Before you read any other commodity tips, you need to understand the concept. Commodities are structured trades around the delivery, sale, import, and export of a particular good. Popular commodities include oil, gold, and soybeans. The most popular strategy for investing in commodities is signing a futures contract. These ensure that you will own the commodity for a set amount of time before selling it on a certain date at a specific price. Here are a few tips for making the most out of your commodity trades in 2017. Why ETFs Are A Good...
Technical Analysis >> Commodity, Brazil, Euro and Dollar Index

Image
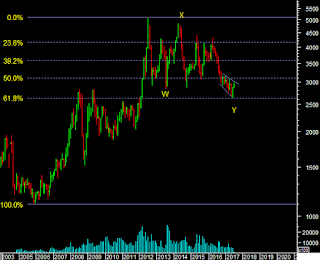
SOY BEAN NCDEX Soy bean prices formed an expanding triangle near the 61.8% mark. Last time I wrote that a bounce can occur because of the triangle but as shown why not a bottom? Possible Wave Y is over. Either another X wave up retracing the Y or the start of a major impulse. The trend should be up as long as we are above 2650. Breakout of the triangle above 3035 to go to 3286. COPPER MCX Copper Closed the week down. Now 365 is the next support. Halting near retracements it is still possible that copper is within a larger corrective structure. The recent rally is not certainly impulsive. So if 365 breaks wee can see it go back to test the 353 low [below 2.62$ to 2.48$]. ZINC MCX Base metals are showing a near term correction after Lead, Aluminium and Zinc look like completing near term 5 wave rallies. The indication therefore is of a positive trend ahead but after a pause correction or retracement. The size of a pullback is hard to say. For Zinc below the 20dma at 1...

Currency, US 30 Year Treasury Bonds, Nasdaq, DAX, Karachi Index and Commodity - Technical Analysis

Image
US TREASURY BONDS While the 10 year has already broken the rising channel 2 days ago the 30 year bonds are now at the rising trendline near 152. So a further decline in the bond market will get this second confirmation of a break down in the bond market. We would be at the start of a 3rd wave down in US bonds. [We have discussed this scenario and its impact in this months Long short report.] USDCAD The last post identified the Wave B high at 61.8%. From there we have a 5 wave decline so the down trend is established. We may get the first retracement of the fall when the 5 wave decline completes but the larger trend down will resume again, till C=A is achieved. The RSI is getting oversold. 1.33 near the wave 4 high would be a resistance level during a counter trend move up. After that we may head to 1.25 in wave 3 of C. EURO The euro/dollar did not achieve 1.15 and it is hard to say yet that prices have started wave 2 down. When they do we get a retracement of the...