Posts

Showing posts with the label Euro

Technical Analysis of Euro, US 10 Years Treasury Notes, Commodities, CRB Index, DOW, NASDAQ, BSE 200 and DAX

Image
EURO The Euro bull run continued even as bearish sentiment is in single digits. This excessive near term bullish traders reading continues to mean that a 5 wave rise is closer to completion. For the rally to continue unabated a pause or consolidation is needed. That said the big picture remains bullish as everyone has the narrative wrong. US 10 YEARS TREASURY NOTES The 10 year note has retraced almost 50% and wave c=a is nearly done. wave ii should be near completion and wave iii down is to unfold next soon. ------------------- COMMODITIES Gold Gold has its neckline of the lows [blue line], at 1238. So that is a key resistance level. Daily momentum did turn positive and prices broke out of the falling channel but some more signs are needed that the trend has changed to up for good. Aluminium MCX Aluminium rallied in 5 waves and retraced 61.8% at 121.70. Dipped to a low of 120.90. So these supports should help propel it into wave iii up iii=i points to 127.50

Technical Analysis >> Commodity, Brazil, Euro and Dollar Index

Image
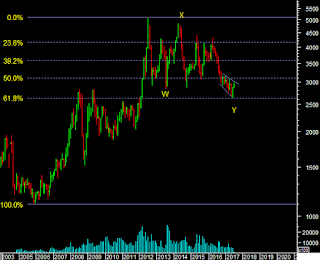
SOY BEAN NCDEX Soy bean prices formed an expanding triangle near the 61.8% mark. Last time I wrote that a bounce can occur because of the triangle but as shown why not a bottom? Possible Wave Y is over. Either another X wave up retracing the Y or the start of a major impulse. The trend should be up as long as we are above 2650. Breakout of the triangle above 3035 to go to 3286. COPPER MCX Copper Closed the week down. Now 365 is the next support. Halting near retracements it is still possible that copper is within a larger corrective structure. The recent rally is not certainly impulsive. So if 365 breaks wee can see it go back to test the 353 low [below 2.62$ to 2.48$]. ZINC MCX Base metals are showing a near term correction after Lead, Aluminium and Zinc look like completing near term 5 wave rallies. The indication therefore is of a positive trend ahead but after a pause correction or retracement. The size of a pullback is hard to say. For Zinc below the 20dma at 1