Posts

Showing posts with the label Adam Smith Associates

Trade Finance as a Business Development Strategy

Image
 Business Team Planning Business Development Strategy in Office Without trade finance, there wouldn't be Indian spices, clothes, or jewelry in the United States. Or Apple's iPhones in China, much less any other international product at any respectable distance from its origin. In fact, according to Investopedia , the World Trade Organization (WTO) estimates that international world trade has expanded 80%-90% thanks to trade finance. For this to continue, companies need to include trade finance in their business development strategies. How do you do that? Learn how you can incorporate trade finance into your business development strategy. Incorporate Inland Trade Finance in Market Penetration and Market Development Market penetration and market development are key parts of a business development strategy. Market development involves selling more of your service or product to repeat customers. While market penetration is about expanding your product or ser...

Strategic Trade Risk Mitigation Solutions

Image
  Are you about to enter the domain of international trade and expand base in India? If yes, it is imperative for you to know about the variegated challenges you might have to face. To name a few, politics, law, finance and more, can affect your venture. With tonnes of responsibilities to shoulder, you may find it hard to concentrate on the trade risks and their solutions. In such circumstances, a trade finance company can come to your assistance.    The professionals can not only only tell you about the potential risks, but also advise you in trade risk mitigation planning.   Here Are 4 Mitigation Strategies To Look Into Decide on an Apt Business Partner Your business partner in India is your support in an unknown, foreign territory. Choose a partner, which has professionals, who are familiar with the business practices, culture and regulations in the host country. Remember, a strategic alliance, with the right collaborator can provide you wit...

Structured Trade Finance - What Does it Mean?

Image
Business man counting his finances Structured trade finance (STF), a type of debt finance, is used as an alternative to conventional lending. This form of finance is utilized regularly in developing countries, as well as, in relation to cross border transactions. The objective is to encourage trade by making use of non-standard security. STF is generally used in high-value transactions in bilateral trading relationships. As a more complicated type of finance, STF is commonly related to commodity trading. Within the commodity sector, STF products are most prevalent. It is used by producers, processors, traders, as well as, end-users. These financial arrangements are tailored by banking organizations to meet the precise needs of the clients. STF products are primarily working capital financing, warehouse financing and pre-export financing. There are also some institutions that extend reserve-based lending, as well as, finance the conversion of raw materials into products, along...

Technical Analysis of Euro, US 10 Years Treasury Notes, Commodities, CRB Index, DOW, NASDAQ, BSE 200 and DAX

Image
EURO The Euro bull run continued even as bearish sentiment is in single digits. This excessive near term bullish traders reading continues to mean that a 5 wave rise is closer to completion. For the rally to continue unabated a pause or consolidation is needed. That said the big picture remains bullish as everyone has the narrative wrong. US 10 YEARS TREASURY NOTES The 10 year note has retraced almost 50% and wave c=a is nearly done. wave ii should be near completion and wave iii down is to unfold next soon. ------------------- COMMODITIES Gold Gold has its neckline of the lows [blue line], at 1238. So that is a key resistance level. Daily momentum did turn positive and prices broke out of the falling channel but some more signs are needed that the trend has changed to up for good. Aluminium MCX Aluminium rallied in 5 waves and retraced 61.8% at 121.70. Dipped to a low of 120.90. So these supports should help propel it into wave iii up iii=i points to 127.50 ...

Indian Sentiments Update

Image
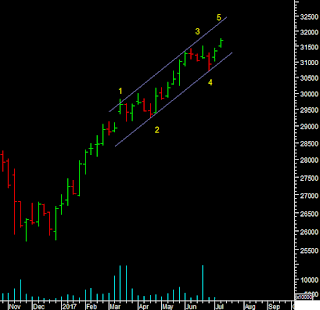
The weekly chart of the Sensex provides for a more reliable count for the move now. With the moves since march fitting a rising channel. Wave 1 and 3 here are 5 waves and 3<1, so we are in wave 5 which will be smaller still. And will end at or before the upper channel line at 32300. Will it be a one side move in wave 5 or also a subdivision like the first two impulse waves. While both are possible, subdivisions do sometimes repeat and if so then this last 5 waves up could spend a whole month completing even with a smaller target. But it can end abruptly as well. So we will have to see what happens when a smaller degree 5 waves up completes, do we get a trend reversal. The 5th wave can also end up being an ending pattern which would then be 3-3-3-3-3 in terms of its internal wave counts. All the above would have to weighed on what the sentiment is doing? Will FII data remain reliable where P Notes are concerned? Locally registered FIIs can still trade derivatives. So of the In...

Technical Analysis >> Commodity, Brazil, Euro and Dollar Index

Image
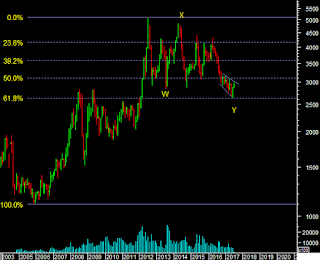
SOY BEAN NCDEX Soy bean prices formed an expanding triangle near the 61.8% mark. Last time I wrote that a bounce can occur because of the triangle but as shown why not a bottom? Possible Wave Y is over. Either another X wave up retracing the Y or the start of a major impulse. The trend should be up as long as we are above 2650. Breakout of the triangle above 3035 to go to 3286. COPPER MCX Copper Closed the week down. Now 365 is the next support. Halting near retracements it is still possible that copper is within a larger corrective structure. The recent rally is not certainly impulsive. So if 365 breaks wee can see it go back to test the 353 low [below 2.62$ to 2.48$]. ZINC MCX Base metals are showing a near term correction after Lead, Aluminium and Zinc look like completing near term 5 wave rallies. The indication therefore is of a positive trend ahead but after a pause correction or retracement. The size of a pullback is hard to say. For Zinc below the 20dma at 1...

Currency, US 30 Year Treasury Bonds, Nasdaq, DAX, Karachi Index and Commodity - Technical Analysis

Image
US TREASURY BONDS While the 10 year has already broken the rising channel 2 days ago the 30 year bonds are now at the rising trendline near 152. So a further decline in the bond market will get this second confirmation of a break down in the bond market. We would be at the start of a 3rd wave down in US bonds. [We have discussed this scenario and its impact in this months Long short report.] USDCAD The last post identified the Wave B high at 61.8%. From there we have a 5 wave decline so the down trend is established. We may get the first retracement of the fall when the 5 wave decline completes but the larger trend down will resume again, till C=A is achieved. The RSI is getting oversold. 1.33 near the wave 4 high would be a resistance level during a counter trend move up. After that we may head to 1.25 in wave 3 of C. EURO The euro/dollar did not achieve 1.15 and it is hard to say yet that prices have started wave 2 down. When they do we get a retracement of the...