Indian Sentiments Update
The weekly chart of the Sensex provides for a more reliable count for the move now. With the moves since march fitting a rising channel. Wave 1 and 3 here are 5 waves and 3<1, so we are in wave 5 which will be smaller still. And will end at or before the upper channel line at 32300. Will it be a one side move in wave 5 or also a subdivision like the first two impulse waves. While both are possible, subdivisions do sometimes repeat and if so then this last 5 waves up could spend a whole month completing even with a smaller target. But it can end abruptly as well.
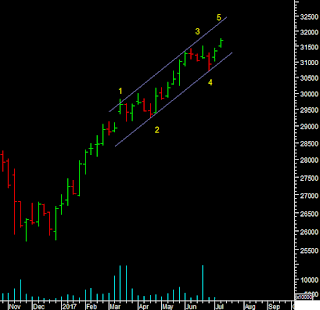
So we will have to see what happens when a smaller degree 5 waves up completes, do we get a trend reversal. The 5th wave can also end up being an ending pattern which would then be 3-3-3-3-3 in terms of its internal wave counts.
All the above would have to weighed on what the sentiment is doing? Will FII data remain reliable where P Notes are concerned? Locally registered FIIs can still trade derivatives. So of the Index futures OI for FIIs. how much is P Notes? It would be a small amount. FIIs have a total of 1082696 contracts open in F&O yesterday evening. Not all are P Notes. So at a contract level yesterdays total Open contracts are higher than day before. So where is the big reduction in positions? However when we measure the net positions as long or short based on these charts it show that FIIs continue to reduce their index longs in futures over the last month. Will keep watching this data and so far as there is no major change in OI the data remains reliable, and P Notes are not affecting this much so far as P Note exposures have been coming down over the year since the regulator has been pushing for the same for a long time.

Another Indicator that I discussed in last weeks video update was the Client side options positions. That spiked yesterday to -33% short as Put OI hit a new high. I have inverted the indicator at the bottom of the chart so that negative readings can be associated with market tops. While rising Put OI is bullish, at extremes it becomes contrarian. Most tops were seen when we went higher than -30%.

The OI Put Call ratio for the market reached 1.228 above the red line shown below. The last high reading was in May that caused more of a broad market reaction than Nifty.

Anther way to look at the Call Put ratio is the actual difference than the ratio. Note the above two and this below are reflecting a big jump in PUT OI from different angles. This chart shows that when in value terms the OI is at negative 15k crore there are many market highs and lows, but at close to 20k crore near the red line we get some important highs and lows. Yesterday we were at -19320 crore. We were at a similar reading before the May top in Midcaps this year, the March 2015 top in NIfty [9119] and the Feb 2012 top and April 2011 market high.

-------------------------------
Adam Smith Associates offers trade & commodity finance related services & solutions to its domestic and international clients. Visit www.adamsmith.tv for services offered by Adam Smith Associates Pvt. Ltd.
Views expressed in this article are purely of the author – Mr Rohit Srivastava – a leading technical analyst.