Adam Smith Associates - Dollar Index The Big Picture

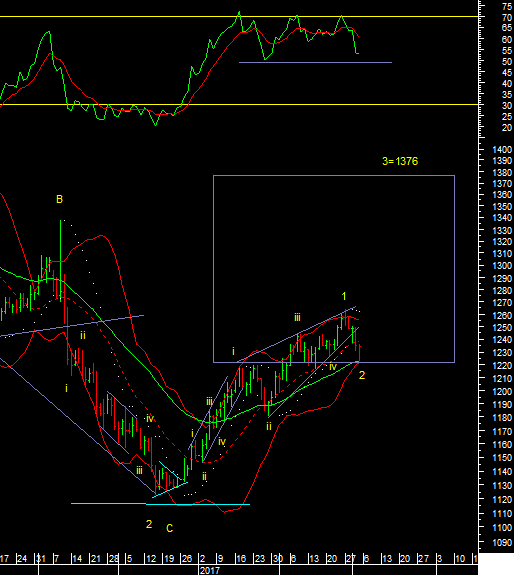
Adam Smith Associates offers trade & commodity finance related services & solutions to its domestic & international clients. Views expressed in this article are purely of the author - Mr Rohit Srivastava - a leading technical analyst. Visit www.adamsmith.tv for services offered by Adam Smith Associates Pvt Ltd The Big Picture - The Dollar index follows cycles and is due to turn down into the next 7 year bear market sooner than later. This chart of the dollar index says so. If cycles repeat they should.