Posts

Commodity Technical Analysis Adam Smith Associates

Image
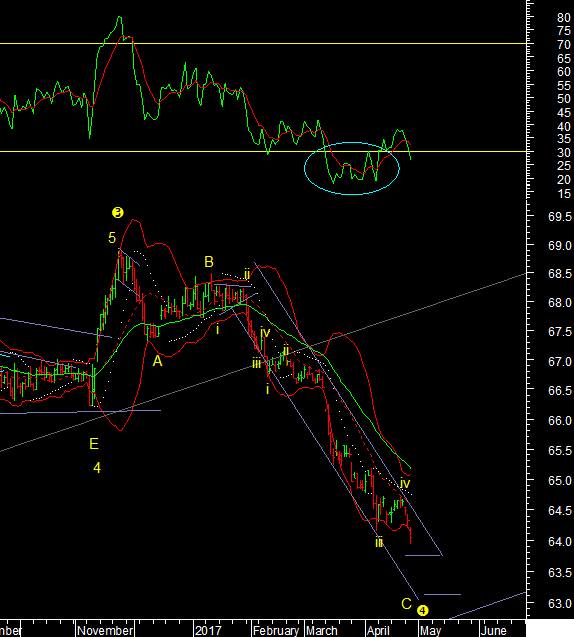
BSE Metal The BSE Metals index remains in a downtrend. The recent bounce back is facing resistance near the averages and if we break the rising trendline of the 1 year long channel then it would confirm that we head to 9500 on the index, a deeper cut in prices. A move below 10897 could be negative. Sugar NCDEX The reason to be careful about Sugar prices international is that often local agro prices do not move with the global ones in the near term. This is unlike the metals where they move in tandem. So local sugar prices did peak but did not fall with the global trend. But the wave counts still indicate lower prices on the NCDEX chart, so it might be better to wait and see what happens here before taking a stance on the sector. Copper A False Break Out The recent move up in copper was again an x wave. In many base metals I did note that either an x wave or new move is on. But I did think the flag breakout on copper could mean more. That is violated

Dollar Index Technical Analysis Adam Smith Associates

Image
The fall in the dollar shows the potential to extend lower without major bounces. Reason is that the third wave in the fall from the April high was shorter than the first. Meaning that it can fall through the trendline of the lows at 98.50 in a single move in the next drop. The drop will be watched closely by all currency traders as it would also break the rising trendline from the May 2017 bottom. On this chart we do have a marginal close below the line but a further decline would make it crystal clear. Adam Smith Associates offers trade & commodity finance related services & solutions to its domestic & international clients. Views expressed in this article are purely of the author - Mr Rohit Srivastava - a leading technical analyst. Visit www.adamsmith.tv for services offered by Adam Smith Associates Pvt Ltd

Currency Technical Analysis Adam Smith Associates

Image
USDINR Again gave up from the 20dma and stared to decline. Draw a falling channel to the fall and we should be in wave v of C again with two fibonacci targets 63.75 and 63.10, either of them could support a bottom. A move above the 20dma would however be the final confirmation as it has been the key resistance zone. EURO The Euro paused after a 5 wave advance from the April bottom. What may occur is a near term retracement of this rise before the trend up continues. The size of a pullback is hard to gauge right away. A move above the recent high of 1.095 would mean we are extending higher anyway. 1.08 would be the 38.2% retracement support which is just at the big gap up area. Gaps can act as important supports in an uptrend. USDCNY While the dollar has been falling the Chinese Yuan has spent months consolidating into a triangle which is typically a 4th wave. I was anticipating a larger degree wave 4 formation but this seems like a lower degree cas

CRB Index Technical Analysis Adam Smith Associates

Image
No clear bottom on the commodity index. The CRB index mostly reflects oil but this time with base metals also down it is leading the way lower. It broke the March low yesterday on the weekly chart below. Making the flat the top wave count for now. This can mean wave 5 of (c) down can continue further to 177, but if 177 breaks 171 or 168 may open up. Deeper than I thought but it means that commodities or at least Oil is in the last push lower. This is surprising since the Dollar is falling already. So I have my fingers crossed. A regular flat meaning a double bottom at 177 is ideal. Adam Smith Associates offers trade & commodity finance related services & solutions to its domestic & international clients. Views expressed in this article are purely of the author - Mr Rohit Srivastava - a leading technical analyst. Visit www.adamsmith.tv for services offered by Adam Smith Associates Pvt Ltd

Commodity Technical Analysis Adam Smith Associates

Image
Zinc The daily momentum for Zinc crossed over to a buy and at 38.2% retracement of last years entire rally this is a good level near 162 to call a bottom. If we are only bouncing back we go to 175, in case of an X wave we can retrace 61.8% up to 185 and best case scenario is that a new rally has started. Will take each case as it develops. But the trend could be up in the near term from 162. Crude The hourly chart of crude below shows a ending diagonal and breakout near term so maybe we finally have a bottom in place. 48.87 is the low made yesterday so if it holds we can say that wave b ended and wave c up to 57.50 can now start. Silver Silver broke the 17.65 low and am considering the same for Silver as well. Wave 2 may change to a larger flat pattern. A 3-3-5 correction from the Feb high means that we can go back to test the 16.78 low, near 61.8% of wave 1. Nickel MCX Nickel Mcx is falling in 5 waves in wave C. RSI at 28 yesterday was overs

Gold And The Expanded Flat Adam Smith Associates

Image
The close below the 20dma favors the idea that the 3 wave rise from the point marked A is a-b-c or a B wave. Even though it made a new high. A new high in wave B only happens in expanded flat patterns. In this wave B should ideally not exceed 138.2% of A and it is exactly that. Wave C then = 161.8% of wave A and that gives us a number of 1182 as the potential target. 1182 is also near the Jan'17 swing low and 66% retracement of the entire pattern at 1180. Wave C has to be 5 waves down that goes below the low of wave A [1194]. Adam Smith Associates offers trade & commodity finance related services & solutions to its domestic & international clients. Views expressed in this article are purely of the author - Mr Rohit Srivastava - a leading technical analyst. Visit www.adamsmith.tv for services offered by Adam Smith Associates Pvt Ltd

Technical Analysis GBP USD Adam Smith Associates

Image
Here is a big picture possibility with the Pound. For a while I have been clear that the dollar topped and that the Yen and Euro would go up. But the Pound was the outlier. It was forming a triangle as in a 4th wave. But now that prices have moved the other way. I wonder if the GBP is also going to rise on the dollar. That puts the trend into stone then. The dollar goes down against all the AE[advanced economy] currencies. This is a monthly chart from 1980 and you see that the recent low was at the parallel channel of the tops. So the only reason to not consider a bottom was that C=A was not achieved in the last 2 years decline. But that is not necessary. It is possible that wave C completed 5 waves as shown in the second chart below. If true we are at a multi year bottom in the GBP and it goes back to 2.15 against the dollar over 5 years. Yes Long term. The second chart below shows the markings of 5 waves up for wave C for the USDGBP [inverse of the above GBPUSD].