Posts

Indian Sentiments Update

Image
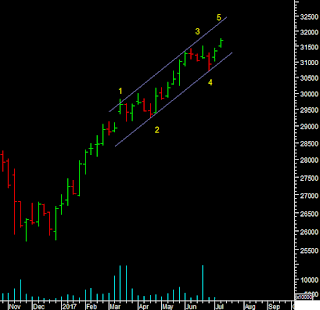
The weekly chart of the Sensex provides for a more reliable count for the move now. With the moves since march fitting a rising channel. Wave 1 and 3 here are 5 waves and 3<1, so we are in wave 5 which will be smaller still. And will end at or before the upper channel line at 32300. Will it be a one side move in wave 5 or also a subdivision like the first two impulse waves. While both are possible, subdivisions do sometimes repeat and if so then this last 5 waves up could spend a whole month completing even with a smaller target. But it can end abruptly as well. So we will have to see what happens when a smaller degree 5 waves up completes, do we get a trend reversal. The 5th wave can also end up being an ending pattern which would then be 3-3-3-3-3 in terms of its internal wave counts. All the above would have to weighed on what the sentiment is doing? Will FII data remain reliable where P Notes are concerned? Locally registered FIIs can still trade derivatives. So of the In

Technical Analysis >> Commodity, Brazil, Euro and Dollar Index

Image
SOY BEAN NCDEX Soy bean prices formed an expanding triangle near the 61.8% mark. Last time I wrote that a bounce can occur because of the triangle but as shown why not a bottom? Possible Wave Y is over. Either another X wave up retracing the Y or the start of a major impulse. The trend should be up as long as we are above 2650. Breakout of the triangle above 3035 to go to 3286. COPPER MCX Copper Closed the week down. Now 365 is the next support. Halting near retracements it is still possible that copper is within a larger corrective structure. The recent rally is not certainly impulsive. So if 365 breaks wee can see it go back to test the 353 low [below 2.62$ to 2.48$]. ZINC MCX Base metals are showing a near term correction after Lead, Aluminium and Zinc look like completing near term 5 wave rallies. The indication therefore is of a positive trend ahead but after a pause correction or retracement. The size of a pullback is hard to say. For Zinc below the 20dma at 1

Currency, US 30 Year Treasury Bonds, Nasdaq, DAX, Karachi Index and Commodity - Technical Analysis

Image
US TREASURY BONDS While the 10 year has already broken the rising channel 2 days ago the 30 year bonds are now at the rising trendline near 152. So a further decline in the bond market will get this second confirmation of a break down in the bond market. We would be at the start of a 3rd wave down in US bonds. [We have discussed this scenario and its impact in this months Long short report.] USDCAD The last post identified the Wave B high at 61.8%. From there we have a 5 wave decline so the down trend is established. We may get the first retracement of the fall when the 5 wave decline completes but the larger trend down will resume again, till C=A is achieved. The RSI is getting oversold. 1.33 near the wave 4 high would be a resistance level during a counter trend move up. After that we may head to 1.25 in wave 3 of C. EURO The euro/dollar did not achieve 1.15 and it is hard to say yet that prices have started wave 2 down. When they do we get a retracement of the

The Upside to Trade Finance Advisory

Image
The Upside to Trade Finance Advisory Popular search engines are excellent examples, with over 75% annual earnings before five decades. I ask that you explore our site, which provides rich info on APICORP's history, strategy, activities and achievements, and valuable industry research. Here you'll find some helpful information about ways to mitigate risks whenever you are in a global trade. Even during intervals of low oil prices and financial crises, we've efficiently facilitated the access to capital for the business. It's important to know about the further costs related to making use of a letter of credit. Many emerging markets provide opportunities which you cannot get in the country anymore. Through the years, the energy industry in the area has grown to play a critical role in the world economy. The company buying the receivables is known as a factor. So as your company grows so does the quantity of funding that is available to you. Trade finance is relat

US 30 Years Treasury Bonds, Dow Utilities, S & P 500, Currency And Dollar, Commodity - A Technical Analysis

Image
US 30 YEARS TREASURY BONDS The 30 year bonds are still holding up and in wave v of C up. The bonds might make one more push higher at least and get closer to the upper end of the channel before we get a meaningful trend reversal from the rising trend in bonds. DOW UTILITIES The Dow Utilities chart is a rare one we look at. But here it is. Interesting was that it just touched the trendline from the 2000-2008 highs at the recent high. The entire period fits a channel on a arithmetic scale. S & P 500 S&P is in wave 5 of 5 and near the upper end of a rising channel on the monthly chart [arithmetic scale]. The next trend reversal would end the 8 year long bull market. Wave 1 of 5 was 5 months and 3 took 4 months, we are in the 3rd month of wave 5 and waiting for the next turn. Till then… CURRENCY AND DOLLAR USDBRL Time to consider the bull case for the USDBRL again. The real has taken support on its long term trendline and started to push higher. The

Trade Finance News and Trends

Trade finance modernization turns towards blockchain A study of European treasurers by working capital fintech C2FO finds that 75% are focusing on investing in trade finance technology in 2017. Colin Sharp, senior vice-president, EMEA at C2FO, says the shifting macroeconomic environment is pressuring corporates to refocus their efforts on trade finance: “Treasurers are facing a lot of uncertainty, both from the US and around Brexit. This is putting stress on the supply chain, with demand increasing and decreasing. Treasures want the ability to use their assets to make returns and give some certainty. Source: https://www.euromoney.com/article/b12khnzp4pq9p5/trade-finance-modernization-turns-towards-blockchain --------------------------------------------- ICC Academy unveils new e-course on digital trade finance and fintechs The educational arm of the International Chamber of Commerce (ICC), the ICC Academy, has launched an advanced-level e-course entitled “Digital Trade Financ

Currency Technical Analysis

Image
EURO Euro – c=a points to 1.105 and 38.2% retracement is at 1.102, the trend should still be lower. USDJPY USDJPY should continue higher in wave c up to 115. Support is near 110.60 USDGBP USDGBP – took support on the averages and has mostly started wave 5 up. Support is near 0.783 amd 0.777 and we should be heading to test 0.808 swing high next and eventually the wave 3 high at 0.846. USDCNY USDCNY – corrected in 3 waves in what might be a 4th wave correction in a channel. Wave 5 up could start from 6.78. I cannot rule out a dip to 6.76, while non needed, and it would be a 38.2% retracement of wave 3. 5=1 pionts to 7.04 in wave 5 up. 6.892 resistance from the falling channel where we would have to breakout for higher levels. -------------------------------------------------------------------- Adam Smith Associates Pvt. Ltd. offers trade & commodity finance related services & solutions to its domestic and international clients.   Views ex