Posts

Commodity Technical Analysis - Gold, Copper, Soy Meal CBT, Rough Rice, Silver, Aluminium, Crude, Lead, Zinc and Soy Bean

Image
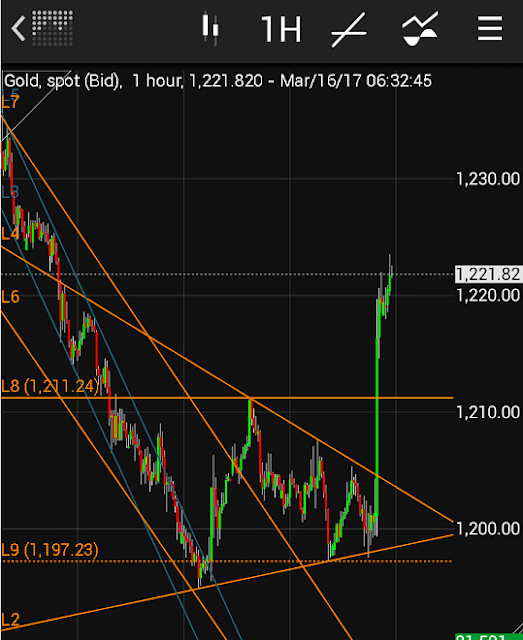
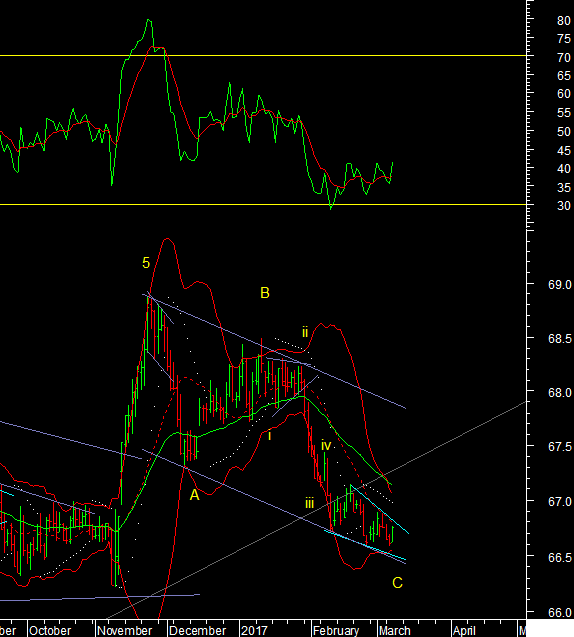
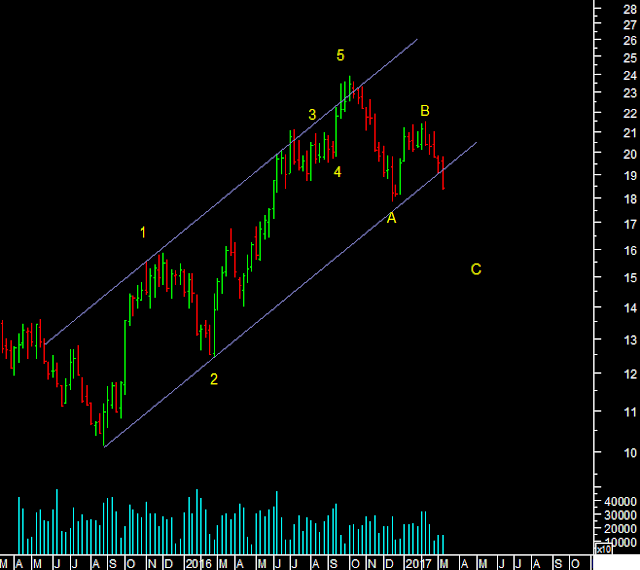
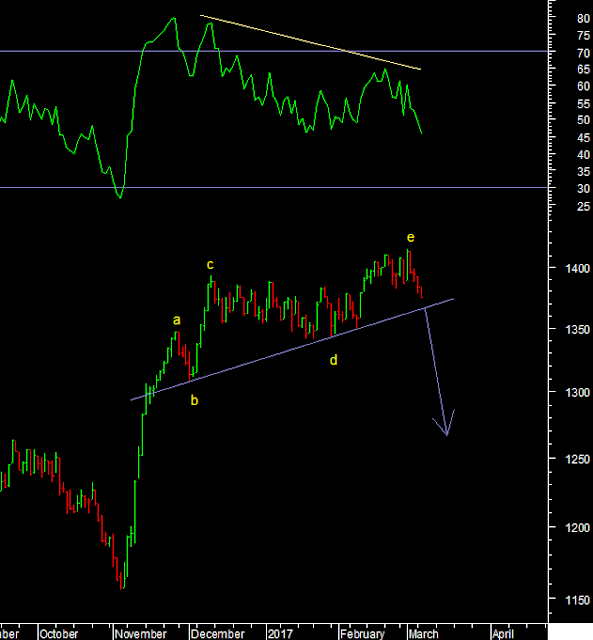
Gold The hourly chart of gold. First we had the breakout from the falling channel after 3 waves down. Then a formation of a triangle at the bottom up to yesterdays low. Wave e of the triangle has a small throw under the lower line. Triangles have occurred at both the previous bottoms in the gold price that were associated with the Fed rate hikes so this is like a pattern now. Breaking out upwards from a triangle should mean a bottom is in place. Copper Copper - sold off the highs today. It is close to the falling trendline from the highs at 2.71. The daily momentum however turned into a buy. The recent low for copper was at the 20 week average. So if prices do breakout above 2.71 it would confirm that the rally is not an X wave before another decline but the start of a move to a new high. Soy Meal (CBT) Soy Meal [CBT] prices have fallen a bit after the small push up from the FEB low. So wave III did not start, but remains due. Daily momentum is pi

Technical Analysis - USDINR, USDCNY, Euro and US 5 Years T Notes

Image
USD INR USDINR has been falling for a while and reached the lower end of a falling channel from the NOV top. At the recent low we have formed a ending diagonal shown in blue. This at the lower Bollinger band with positive divergences in the RSI and momentum in buy mode we have a set up for a bottom. Will the next move end up being a X wave retracing the 3 month decline or the start of a larger move up? That we will answer based on the impulsive behaviour of the rise. 61.8% of the A-B-C fall is at 68 so that would be the initial objective. 67.12 the 40dema would be the first important resistance. USD CNY USDCNY - starts its next move in wave v of III towards 7.05 at the upper end of the long term channel US 5 Years T Notes US Yields made new multi year highs today. I decided to move away from the 10/30 year charts that I usually use because they did not give me a clear indication that we were in wave 4. So the 5 year note was a good idea. The Monthly cha

Commodity technical analysis - Sugar, BSE Metal, Copper and CRB Index

Image
Sugar Sugar Prices in the Global market broke the rising trendline of the channel so I am making this change to the chart for now. This means that Sugar prices might be done here and we might see lower prices in wave C down. This would be a zig-zag and can be a deep correction so sugar stocks can also take a hit near term on this. Prices and stocks do not always correlate but it is a risk to be aware of especially if you are trading. Once done we should see a new rally in sugar prices. Till then we will sit back on this Similarly I must consider that domestic sugar prices have completed wave 5 at the reccent high. I was waiting for wave 5 to extend more but it did not and this means that Sugar prices on NCDEX may fall to the wave 4 low near 3330 at least. If that level breaks we can bet lower levels. Daily weekly momentum is already in sell mode and 3600 is the weekly average support. 38.2% of the 5 wave rise is at 3200 and 50% is at 3000 BSE Metals BSE Meta

Russel 200 CRB Index and Nasdaq Composite Indices technical analysis

Image
Russel 2000 The Russel 2000 index is leading the way down and lagged the Dow in its move to new highs recently. The rollover in prices from record optimism for US stocks marks a point at these highs that maybe important. In other words an important Medium term top may be in place for US stocks. There is also a major divergence at the highs on the RSI as momentum was lost CRB Index The commodity index started wave (c) of B down. The failure to breakout into wave C of larger degree makes this the best case. Commodity prices are reacting accross the board but this index has a larger component of energy. We have to give it time for wave (c) down to complete. Nasdaq Composite I have discussed how the arithmetic scale has been better for US indices since 2009 to fit a channel into the rise. So the Nasdaq composite is not only at the upper end but at the point where wave 5=1, and where wave 3=1.618 times wave 1. This is quite a perfect fractal, textbook to

Adam Smith Associates 30 Year Bond

Image
Adam Smith Associates offers trade & commodity finance related services & solutions to its domestic & international clients. Views expressed in this article are purely of the author - Mr Rohit Srivastava - a leading technical analyst. Visit www.adamsmith.tv for services offered by Adam Smith Associates Pvt Ltd The 30 year bond price has been in a trading range for 2 months that looks like a triangle. 149.80 is the lower end of the range where wave e of B should complete. Following its completion we should expect wave C up to unfold. Rising bond prices have evaded me for a while but we now have multiple bottoms at this level that I believe should eventually lead to higher prices [lower yields]. This might have nothing to do with the FED hike expectations I think but lets see. A 25 basis hike might be priced in at these yields. Bonds might just get the safe haven bid in wave C up.

Adam Smith Associates Volatility Index

Image
Adam Smith Associates offers trade & commodity finance related services & solutions to its domestic & international clients. Views expressed in this article are purely of the author - Mr Rohit Srivastava - a leading technical analyst. Visit www.adamsmith.tv for services offered by Adam Smith Associates Pvt Ltd VIX - Volatility Index The US CBOE VIX has not been making new lows with the new highs in the US stock market. An inter market divergence that maybe indicative of a impending trend reversal.

Adam Smith Associates - Bond Vs Equtiies

Image
Adam Smith Associates offers trade & commodity finance related services & solutions to its domestic & international clients. Views expressed in this article are purely of the author - Mr Rohit Srivastava - a leading technical analyst. Visit www.adamsmith.tv for services offered by Adam Smith Associates Pvt Ltd I have no problem noting that US equities rallied from the point bonds bottomed. But clearaly bond market rallies are associated with equity declines [Dow in this case], and the reverse. So the bond market crash [upper half of chart], is associated with a stock market rally since June [Brexit]. However even after bonds bottomed in Dec they have not taken off upwards and equities have so it is a long wait but sooner than later when you see bond prices get a bid again it will cause an equity market decline. It is just history