Commodity Technical Analysis - Gold, Copper, Soy Meal CBT, Rough Rice, Silver, Aluminium, Crude, Lead, Zinc and Soy Bean
Gold
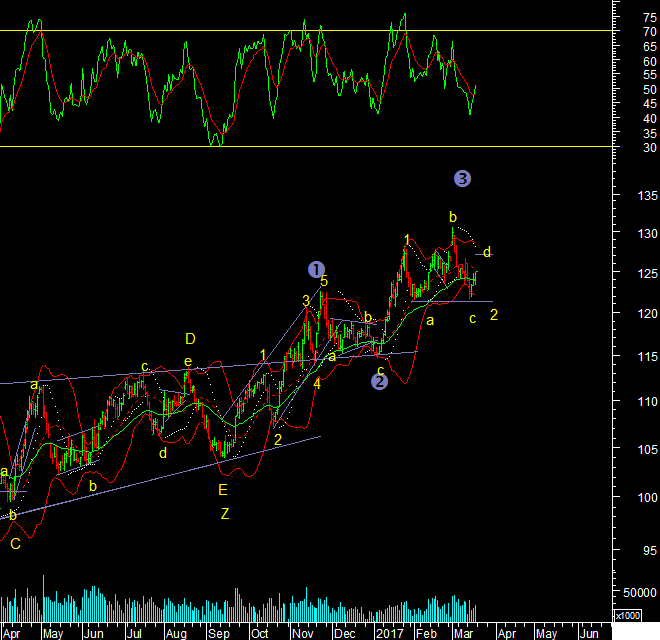
The hourly chart of
gold. First we had the breakout from the falling channel after 3 waves down.
Then a formation of a triangle at the bottom up to yesterdays low. Wave e of
the triangle has a small throw under the lower line. Triangles have occurred at
both the previous bottoms in the gold price that were associated with the Fed
rate hikes so this is like a pattern now. Breaking out upwards from a triangle
should mean a bottom is in place.

Copper
Copper - sold off the highs today. It is close to the falling trendline from
the highs at 2.71. The daily momentum however turned into a buy. The recent low
for copper was at the 20 week average. So if prices do breakout above 2.71 it
would confirm that the rally is not an X wave before another decline but the start
of a move to a new high.

Soy Meal (CBT)
Soy Meal [CBT] prices have fallen a bit after the small push up from the FEB low. So wave III did not start, but remains due. Daily momentum is picking up again A close above 330-331 would be bullish and III=I would point to 370 from here.

Rough Rice
I have been calling a
bottom in Global Rice prices for maybe 2 years and all I have is multiple
bottoms at the same level in what looks like a triangle at the bottom over the
last 2 years. So will this weeks price breakout finally mark the start of the
next major move up in Rice? Yes it is possibl

Silver MCX
Silver MCX prices will follow gold to the averages near 41679 and 41988.
Once we close above these levels we go to 44050.

Aluminium MCX
Aluminium MCX - prices formed a double bottom near 121. So 121 should not
break in either case of a triangle or wave 3 up having already started. 127 is
the 61.8% mark up to which we can say wave d up and wave e for a last test of
121 exists. After that we should be in waved 3 towards 135-140
Crude
Crude - 61.8% comes in at 47.18, as the next level to watch. If prices do
stop here, RSI does show an oversold condition, and we could mark it as a wave
2 bottom. This needs to be watched for a confirmed support as we have been
falling consecutively for a while.

Lead MCX
Lead MCX - has
dropped below the point I was expecting wave III of 5 to kick off. Now it has
retraced 61.8% of the most recent up move. So on the weekly chart it is
possible that wave 4 is forming a triangle. A triangle has 5 waves marked as
a-b-c-d-e inside it and we may be only completing wave c down now. The next
move up would be wave d up to the 158 mark near the upper trendline for the
pattern.

Zinc MCX
Zinc Mcx prices have also been gyrating within the same trading range. So
here too like Lead we may develop a wave 4 triangle. So far we are in wave c. A
triangle has five legs up to wave e. So the next move up would be wave d up to
195 when it starts.

Soy Bean
Soy Bean prices are lower since my last post but the RSI is again oversold at be below 30. Prices are bang on the lower end of the triangle so 2820 is an important support. In wave E prices do sometimes fall below it and then recover back above it. So once we go above and hold above 2820 we should be in wave 5 of larger degree that implies going to new highs above the 5000 mark eventually. 4072 is the upper end of the triangle. 3164 is the first important resistance on the way up. 2991 is the short term resistance above which we get the first signs of upward momentum resuming.
Adam Smith Associates offers trade & commodity finance related services & solutions to its domestic & international clients. Views expressed in this article are purely of the author - Mr Rohit Srivastava - a leading technical analyst. Visit www.adamsmith.tv for services offered by Adam Smith Associates Pvt Ltd