Technical Analysis - USDINR, USDCNY, Euro and US 5 Years T Notes
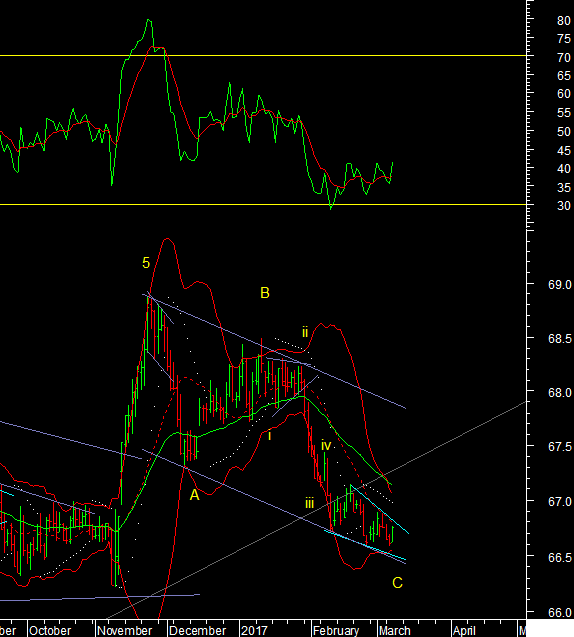
USD INR
USDINR has been falling for a while and reached the lower end of a falling
channel from the NOV top. At the recent low we have formed a ending diagonal
shown in blue. This at the lower Bollinger band with positive divergences in
the RSI and momentum in buy mode we have a set up for a bottom. Will the next
move end up being a X wave retracing the 3 month decline or the start of a
larger move up? That we will answer based on the impulsive behaviour of the
rise. 61.8% of the A-B-C fall is at 68 so that would be the initial objective.
67.12 the 40dema would be the first important resistance.
USD CNY
USDCNY - starts its
next move in wave v of III towards 7.05 at the upper end of the long term
channel
US 5 Years T Notes
US Yields made new
multi year highs today. I decided to move away from the 10/30 year charts that
I usually use because they did not give me a clear indication that we were in
wave 4. So the 5 year note was a good idea. The Monthly chart shows wave C down
developing and we are in wave 5 of C. The final wave is not over as C=A is not
yet achieved as shown by the box. So yields should keep rising for the next few
weeks. This will put pressure on most asset markets in the short term.
Euro
Euro Up Dollar Down - this view got a thumbs up by the impulsive rally late
Friday . So the Euro broke out of a falling trend after forming a ending
pattern at the lows. The Euro retraced 70.7% of wave I, in wave II. The next
move should be higher, and wave III up should test the 1.082 level.
Adam Smith Associates offers trade & commodity finance related services & solutions to its domestic & international clients. Views expressed in this article are purely of the author - Mr Rohit Srivastava - a leading technical analyst. Visit www.adamsmith.tv for services offered by Adam Smith Associates Pvt Ltd


