Commodity technical analysis - Sugar, BSE Metal, Copper and CRB Index
Sugar
Sugar Prices in the Global market broke the rising trendline of the channel so I am making this change to the chart for now. This means that Sugar prices might be done here and we might see lower prices in wave C down. This would be a zig-zag and can be a deep correction so sugar stocks can also take a hit near term on this. Prices and stocks do not always correlate but it is a risk to be aware of especially if you are trading. Once done we should see a new rally in sugar prices. Till then we will sit back on this

Similarly I must consider that domestic sugar prices have completed wave 5
at the reccent high. I was waiting for wave 5 to extend more but it did not and
this means that Sugar prices on NCDEX may fall to the wave 4 low near 3330 at
least. If that level breaks we can bet lower levels. Daily weekly momentum is
already in sell mode and 3600 is the weekly average support. 38.2% of the 5
wave rise is at 3200 and 50% is at 3000

BSE Metals
BSE Metals index was
moving higher but stopped. It stopped at exactly where B=138.2% of A. This is a
critical level for confirming that we have indeed started a fresh move. The
rise so far is not 5 waves clearly on the index and failure at this level
[12350] can mean that we are forming an expanded flat before another move up.
An expanded flat would mean wave C down to 11100 is due first. So the weakness
seen today in Metal stocks might continue a while longer if this turns out to
be true. 11834 is the 20dma as the immediate support to watch if the trend up
is to hold

Copper
The failure of copper
prices to rally recently is having an impact on the weekly charts. The momentum
is dropping and volatility as measured by the Bollinger bands is also
contracting. Indicating further consolidation or correction in prices. 2.58 is
the immediate support and 2.44 the important medium term level.

In terms of wave count, I must go back to the triangle I was marking for the
first nine months of 2016. Remember I initially marked the rise in Sept
as wave 1 and later considered it part of the triangle. Now I have to go back
to wave 1 because it explains the above loss of momentum. That copper may have
completed a 5 wave rally from Sept to Feb. We are now in a deeper correction
[wave 2 or B down] before the next leg up [wave 3 or C] unfolds. The wave 4 low
of 2.448 is the major support here.

CRB Index
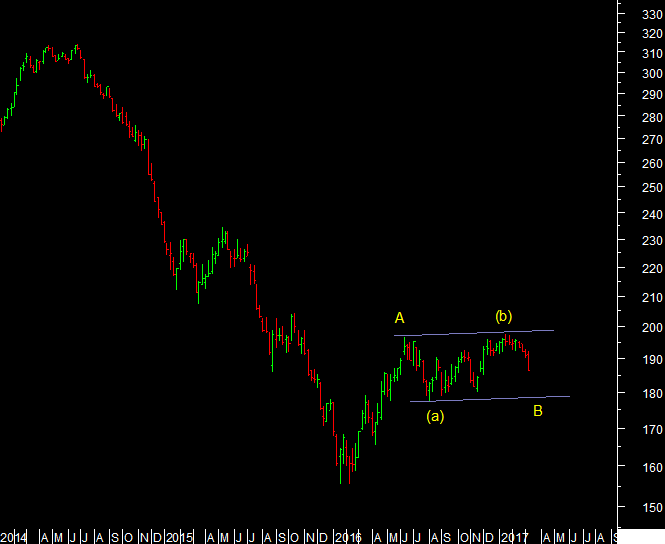
The commodity index started wave (c) of B down. The failure to breakout into
wave C of larger degree makes this the best case. Commodity prices are reacting
accross the board but this index has a larger component of energy. We have to
give it time for wave (c) down to complete.
Adam Smith Associates offers trade & commodity finance related services & solutions to its domestic & international clients. Views expressed in this article are purely of the author - Mr Rohit Srivastava - a leading technical analyst. Visit www.adamsmith.tv for services offered by Adam Smith Associates Pvt Ltd