Posts

Commodity technical analysis adam smith associates

Image
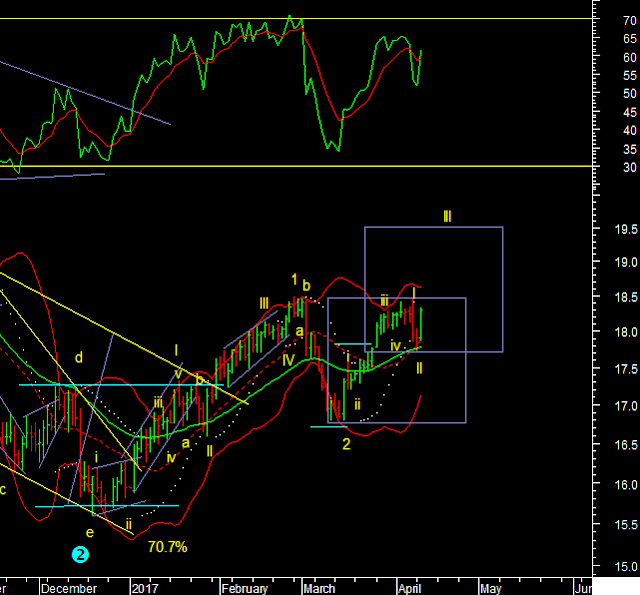
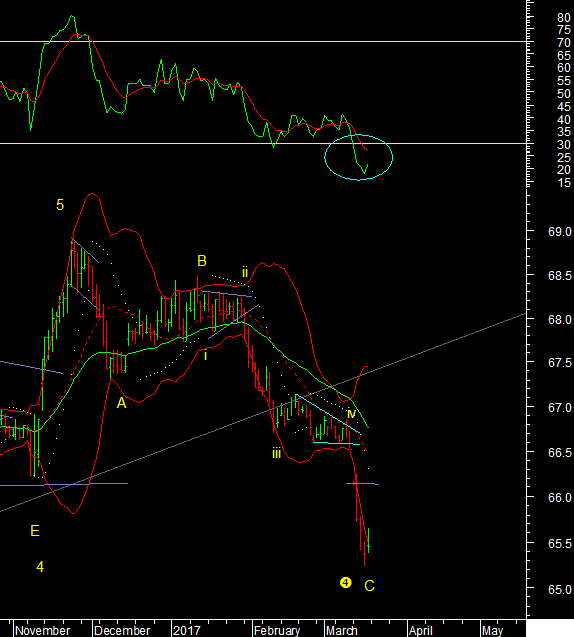
Silver Silver is lagging gold on the way up. At some point that can change. Right now the large CFTC positions are working on putting pressure near term but are also indicative of the longer term interest in the metal. The 20dma at 18.10 is an important support to watch and below that 17.70 would be the next in case prices dip further. Silver can react as the base metals are selling off and so could lag gold in the short term. It may catch up later. Here is the gold silver ration chart when it clearly indicates a break down in the ratio meaning that silver starts to outperform gold longer term. However in the short term that has stopped happening. The ratio is going sideways. I will note when it makes a new low. Soy Bean Not much has happened since my last post on Soy Bean. The positive divergence on RSI is maintained and momentum indicators have crossed over to the buy side. The important support remains the lower end of this potential triangle at

Technical Analysis on NYSE Composite Index, Brazil, Dollar Index, Bond Equity Inversion

Image
NYSE Composite Quarterly divergences on the NYSE Composite have preceded market corrections for the US market. The size varied depending on the time period.  Brazil A Year back I quoted that I would rather be Long BRIC except the 'I'. From a global perspective that was right given that the Brazilian Bovespa index almost doubled. So now when Brazil counts as a completed 5 wave rise where 3<1 and 5<3 I am concerned. Not long term but for the next year that this market could spend making a wave 2 decline maybe retracing down to the 61.8% mark near 50000 Dollar Index The dollar index opened at the 78.6% retracement mark of the last decline and near the upper bollinger band, and near the falling trendline from the Dec top. 101.50 is therefore going to be an important level to decide which side we are headed from here for the dollar index. The bulls or bears are going to have a run on the dollar from here. Just get the direction right. Stayin

CAC - Ahead of the French Elections

Image
CAC - Ahead of the French Elections  The CAC index may top out. Or so the current wave structure suggests. Remember after Brexit I was anticipating that European indices would top out at wave 1 of C shown on the chart. I did not expect wave C to extend into a long drawn 5 wave rise. We are now in the last legs of what should be a 5 wave rise in wave C that has achieved C=A*1.618 in terms of ratio at 5142. So this is a good level for completing this structure. We do need an actual price reversal below the wave IV low that can push weekly indicators into sell mode to confirm this scenario.  Adam Smith Associates offers trade & commodity finance related services & solutions to its domestic & international clients. Views expressed in this article are purely of the author - Mr Rohit Srivastava - a leading technical analyst. Visit www.adamsmith.tv for services offered by Adam Smith Associates Pvt Ltd

Volatility Divergence And Volatility Index Technical Analysis

Image
Volatility Divergence The India VIX has been making new lows recently however I published the US VIX 2 weeks ago to show how the new high in the US market was not confirmed by a new low in the US VIX. Now over the last week the US VIX has shot up to a 3 month high. So unless this spike is a one off and drops overnight the rising US VIX should lead the India VIX higher as well. History shows that all big jumps in the US VIX are followed by a jump in India VIX. So Volatility back home maybe about to take off VIX - Volatility Index The US CBOE Volatility index best known as the VIX has been falling for a year now, with interim bouts of rallies in between. So are we seeing another garden variety bump up in volatility? Given that some of the news is geopolitical it may appear so. But purely on weekly charts the first half of 2015 saw a 5 wave contracting triangle which coincided with a contraction in the Bollinger Bands and then Vols expanded sharply upwards in th

Currency Technical Analysis Adam Smith Associates

Image
USD JPY USDJPY breaks the low and starts a minor wave iii decline that can go to 107, and the 5 wave decline may go to 104. But consider the larger picture. We maybe in wave C of a larger degree correction for the USDJPY. If this turns out to be true then we do not stop at these levels. C=A would point to 95. 95 is also 61.8% of wave 1 that took it from 75 to 125. So a larger degree retracement would complete there. Maybe only after that should we consider a bullish case for the USDJPY pair. The Yen bears are going to have to wait. Too many loud and out there USD INR The USDINR maybe in free fall but the RSI is at 19 for the third time in 2 weeks is very oversold. Now oversold in a falling trend has been meaningless, that is normal. Will it finally be a bottom though? It could be. The waves are in the final legs so it could be anytime. I can't be too bearish on the USDINR given the set up even as it falls. What you do need is a sign of a reversal from ac

Commodity Technical Analysis By Adam Smith Associates

Image
Silver Silver took support on the averages [19.71] and may have started wave III of 3 up. The fractal points to 19.54$ for this move. Support is also at halfway of yesterdays large trading day near 18$. Gold Running Flat Consolidation Done Gold - was in a corrective consolidation pattern that made higher bottoms for the last several days. This kind of correction is rare and because it occurs within a rising trend is called a running flat. In this case it fits a rising channel as shown on the chart. It is also a sign of strength in the underlying trend. Staying above the upper end of the channel at 1272 we are in wave iii of 3 that points to 1327 in the coming days Zinc MCX I have to come to their conclusion that wave 5 ended for many base metals because we are getting deeper retracements. I have already published lower levels for copper and Nickel recently. Zinc I believed that wave 5 made a lower top [called truncated], so it would be wave 1 of 5 an

USD vs INR, GBP, BRL,JPY, TWD Technical Analysis

Image
USDINR The daily RSI came down  to 18.28, a level below 22 has been associated with many previous bottoms. You can however get a few more new lows and positive divergences before the turn around. That said USDINR closed positive and can be marked as complete as a A-B-C decline from the Nov top. Wave C just completed 5 waves down. So unless wave v of C forms an ending pattern and stretches a little lower we should have a bottom at 65.23. 65.20 is also the monthly lower Bollinger band support. USDGBP USDGBP is forming a triangle and wave E down to 0.79 is now in progress. That will complete the triangle as wave E of 4 is the last needed leg. At 0.79 we will have to look for a bottom and the start of wave 5 up as the final push for the current fractal. Will discuss it when it starts to develop USDBRL The Brazilian Real is clearly for Weak Dollar. But people are still debating it. Good. The BRL completed wave B and started wave C down. Wave C now poin